.png)


Why is it important for Lucha t8 users to get information about daily variations of Schumann resonance? Variations in the frequency and amplitude of the Schumann signal may affect human health. Changes in frequency may result in the appearance of higher than usual harmonics (see below explanation what harmonics are) which are known to cause various changes in the functioning of vital organs and it is good practice to regain the beneficial effects of the fundamental Schumann frequency in order to restore the body balance. Thus, in those instances use of Lucha t8 can be of great importance. Similar effects may be caused by variations of the Schumann signal amplitude.
We have chosen the present the widely used reliable monitoring system (station) which collects daily changes in the electromagnetic activities affecting life on the planet Earth. It is located at the Space Observing System (Comprehensive monitoring data) in Tomsk, Russia, which you can access HERE.
This location of the city of Tomsk is at the center of Euro-Asia, and as such enables collection of data relevant for both continents, and even for the Americas, Africa and the Pacific region. The location of Tomsk is indicated in the Google map below.

Fig. 1 Location of the city of Tomsk on the Google world map.
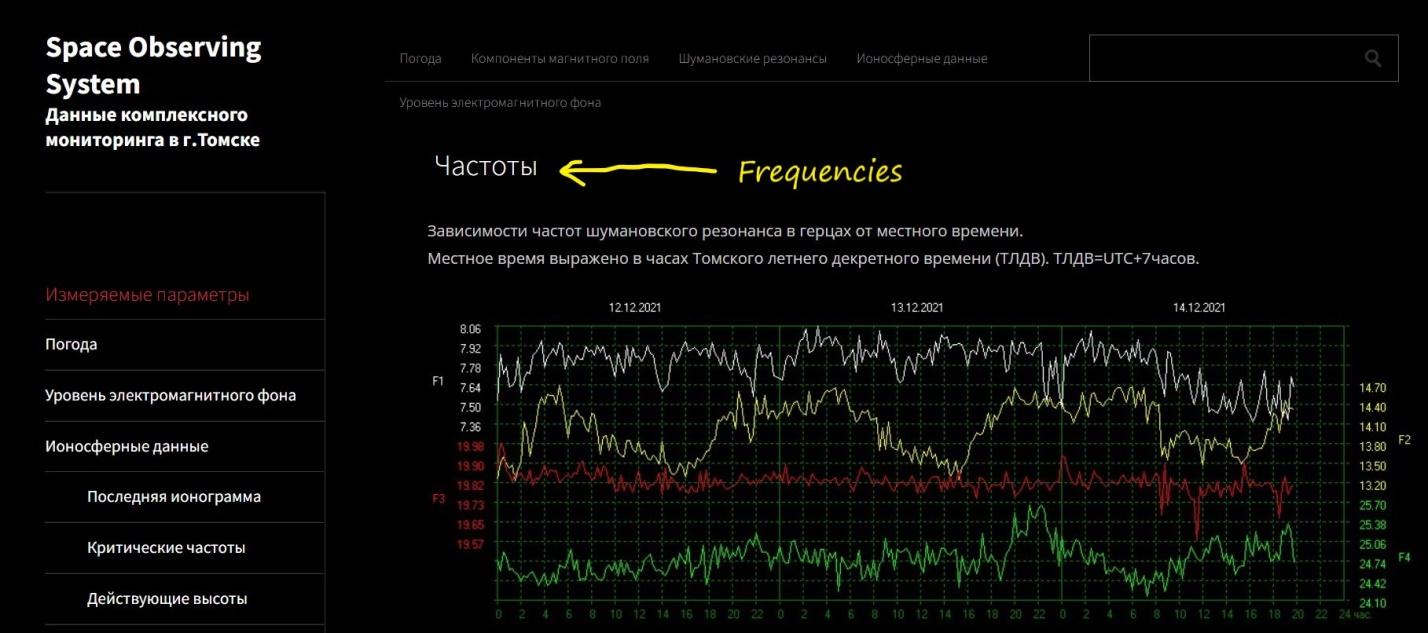
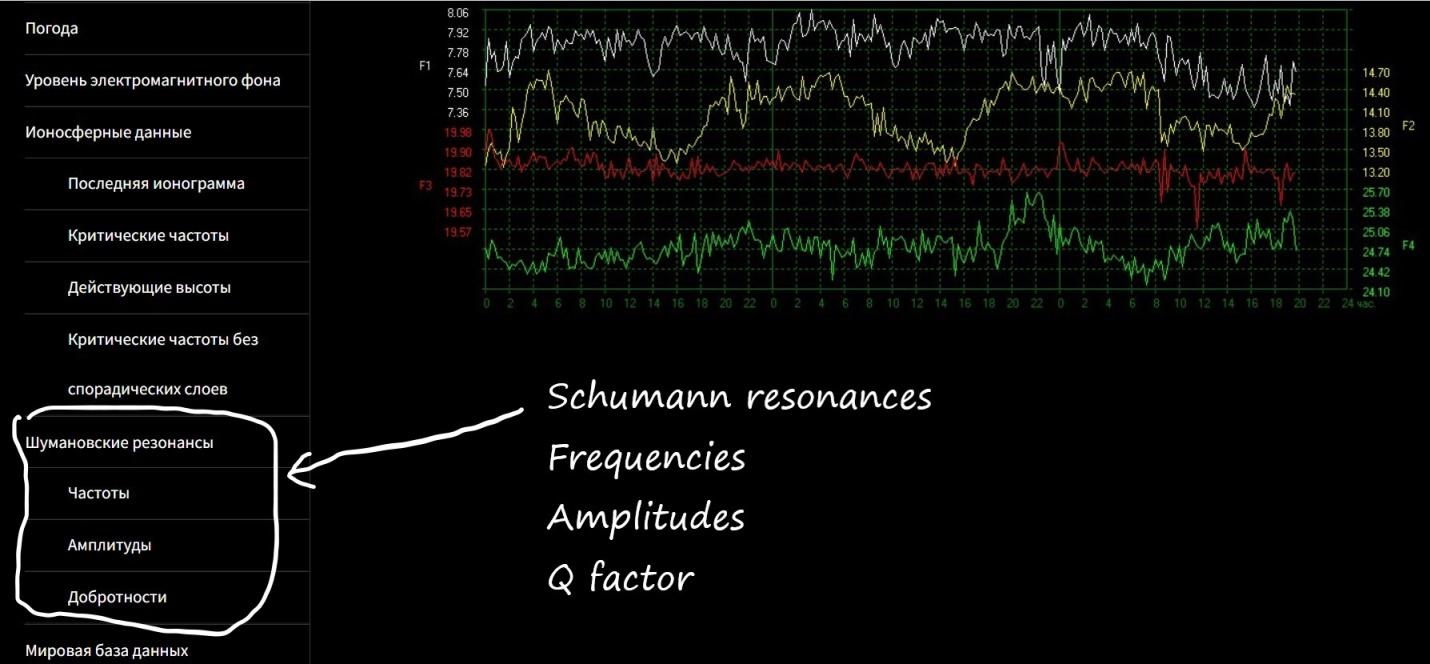
Fig. 1 Webpage screenshot (in Russian) of the Space observing system located in Tomsk, Russia when the option Frequencies is chosen.
The homepage is in Russian, and the English translation is given below.
The relevant part of the menu is under the heading “Schumann resonances”: Frequencies, Amplitudes, Q factors.
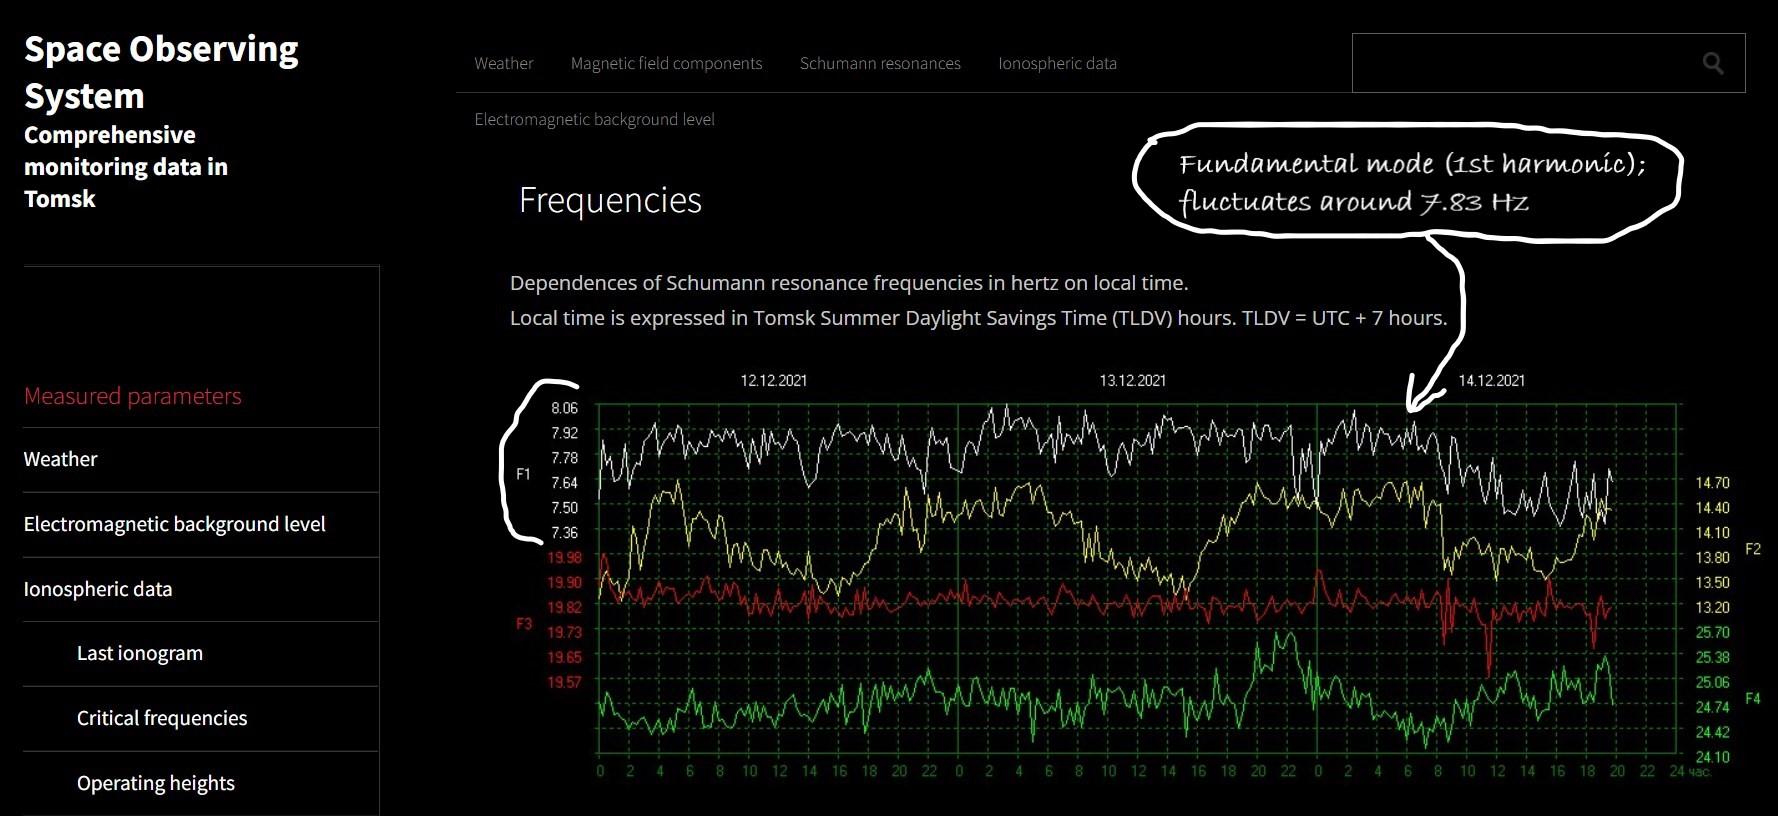
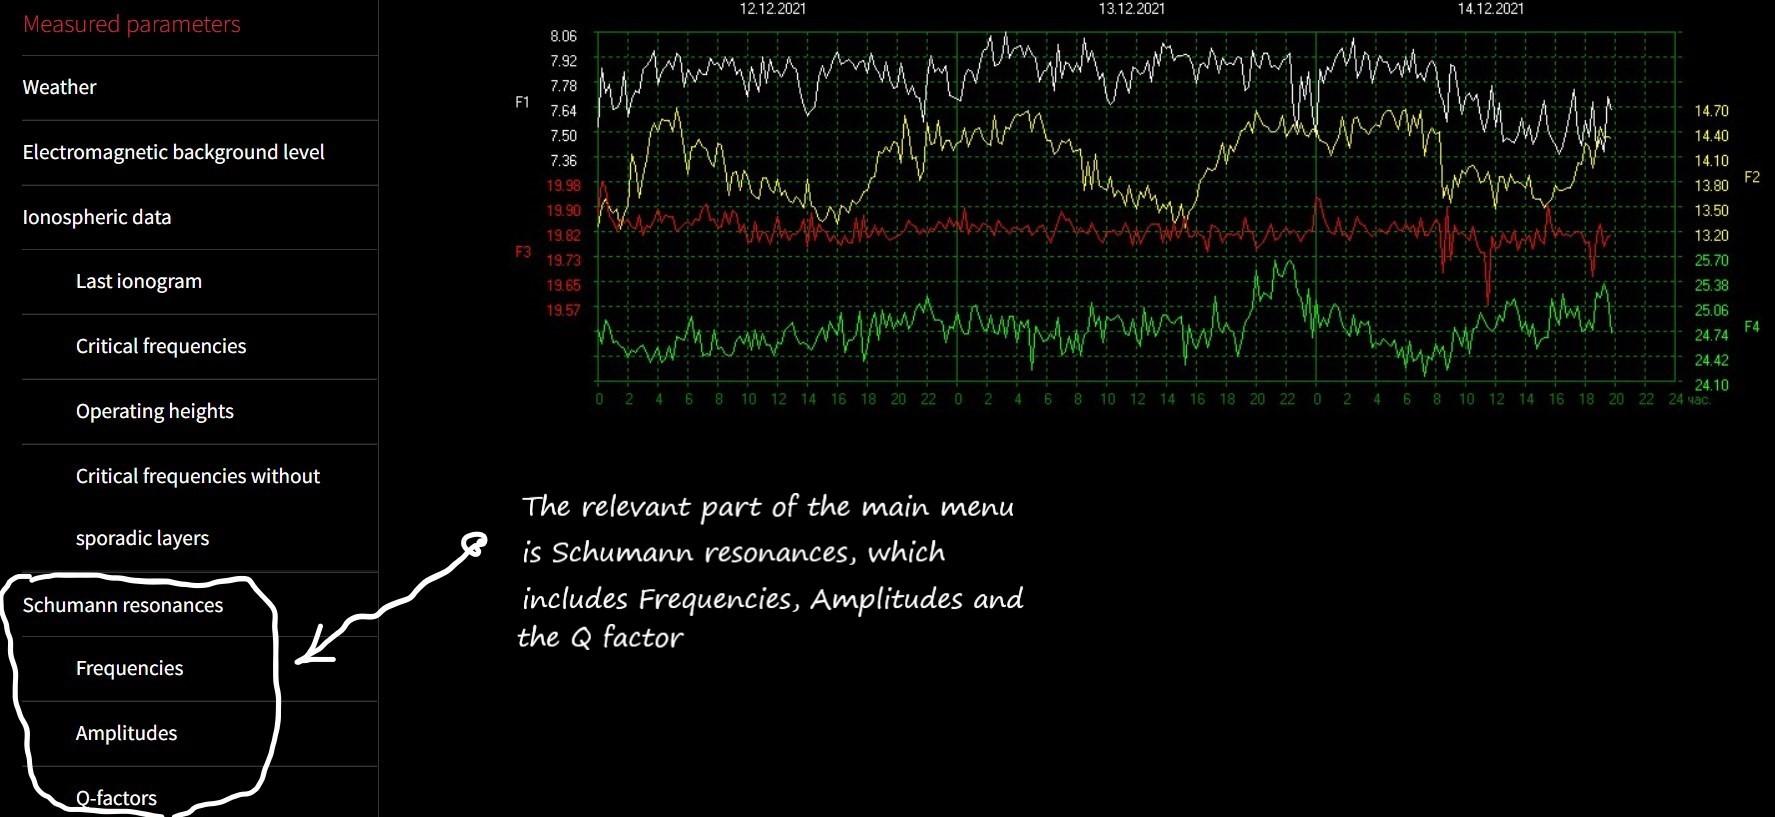
Fig. 3 Webpage Screenshot (in English) of the Space observing system located in Tomsk, Russia. Frequencies of the first four harmonics as a function of daytime are shown.
Once the Frequencies option is chosen, an upper diagram appears containing information about first four harmonics of the Schumann resonances.
But what are harmonics?
Imagine a string elongated and vibrating between two fixed points (also known as the standing wave) as shown in the upper part of Fig.4. This is the fundamental mode, also known as the first harmonic. Four different possible string positions of the fundamental mode are shown for illustration purposes. The string in these examples is the analogue of the electromagnetic wave. Imagine now the situation when two fixed ends slightly vibrate, although this is not the necessary condition. Then, more configurations are possible such as the ones below the fundamental mode, known as the second harmonic, third harmonic, etc. If the frequency of the fundamental mode is, let’s say 1 Hz (Hz is the unit of frequency), then the frequency of the second and the third harmonics are 2 and 3 Hz respectively.
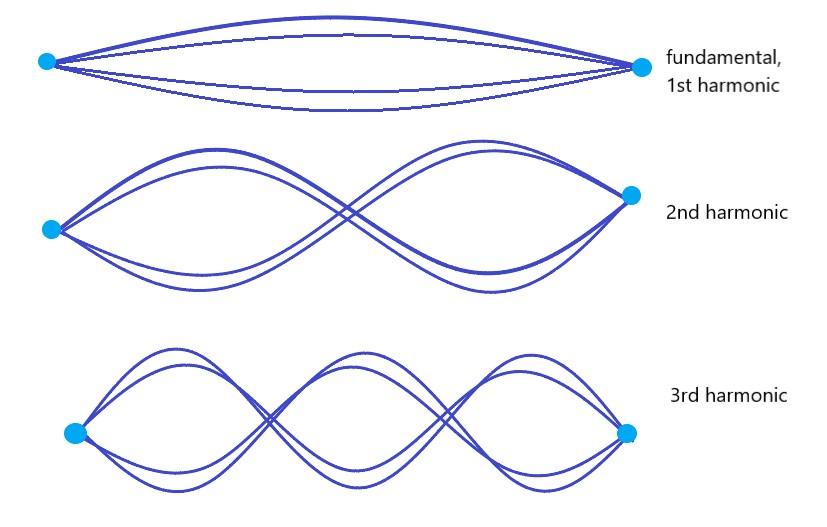
Fig. 4 The first three harmonics of the vibrating string. Each harmonic is illustrated with four different string arrangements.
So, each subsequent harmonic has a higher frequency than the preceding one, and consequently higher than the fundamental mode. The two fixed points keeping the string in place merge into a single point when the standing wave encircles the Earth.
Now, let us return to the homepage of the Tomsk Space observing system. The diagrams depict temporal variations of the first four harmonics of the Schumann resonances. The first harmonic is in white color and the corresponding frequency values, also in white, are indicated on the left vertical axis. The values of the second harmonic, in yellow, are shown at the right hand side of the vertical axis. The third (red) harmonic has values indicated on the left hand side while the fourth harmonic (green) on the right. A quick look at the first harmonic reveals that the fluctuations occur approximately around 7.83 Hz, which is the exact theoretical value for the fundamental harmonic. It is instructive to monitor daily variations due to the influence of Schumann resonance frequencies on human health. In particular, variations in blood pressure may be to a certain degree determined and correlated with the changes in the frequency and amplitude of the harmonics. The amplitude may be monitored by choosing option Amplitudes in the Schumann frequencies menu.
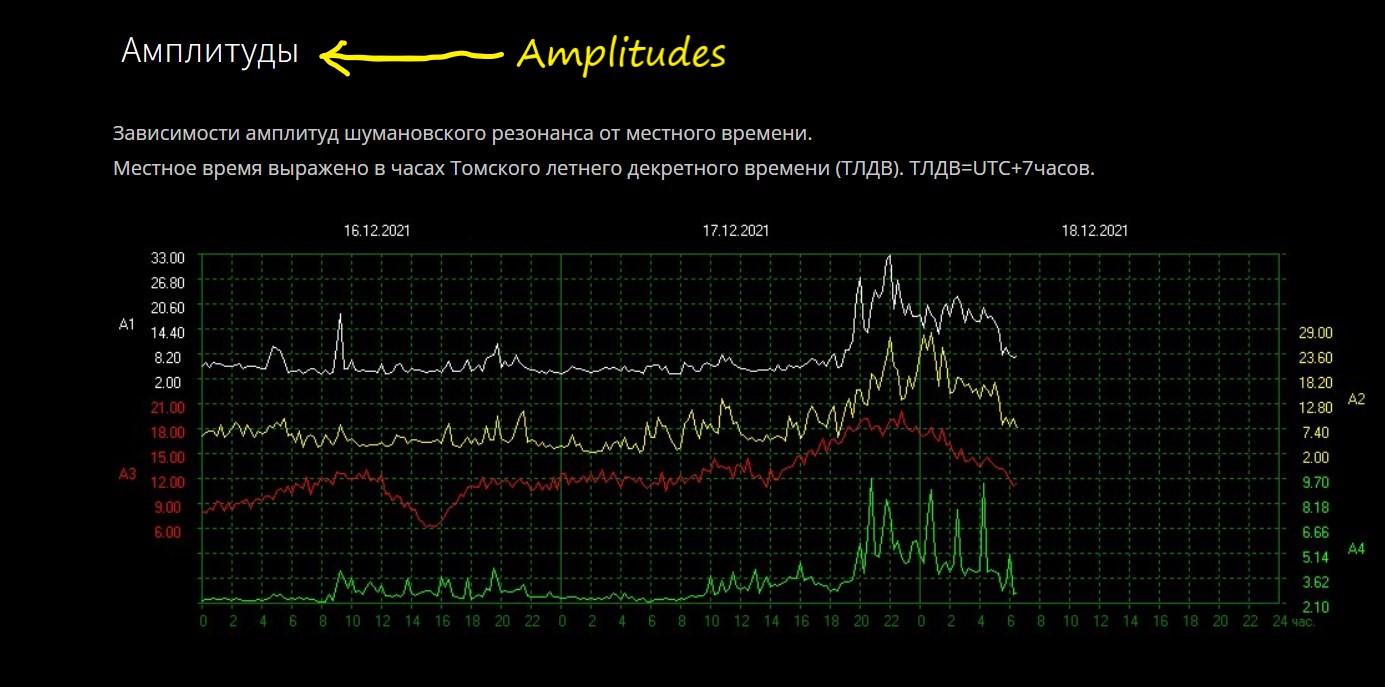
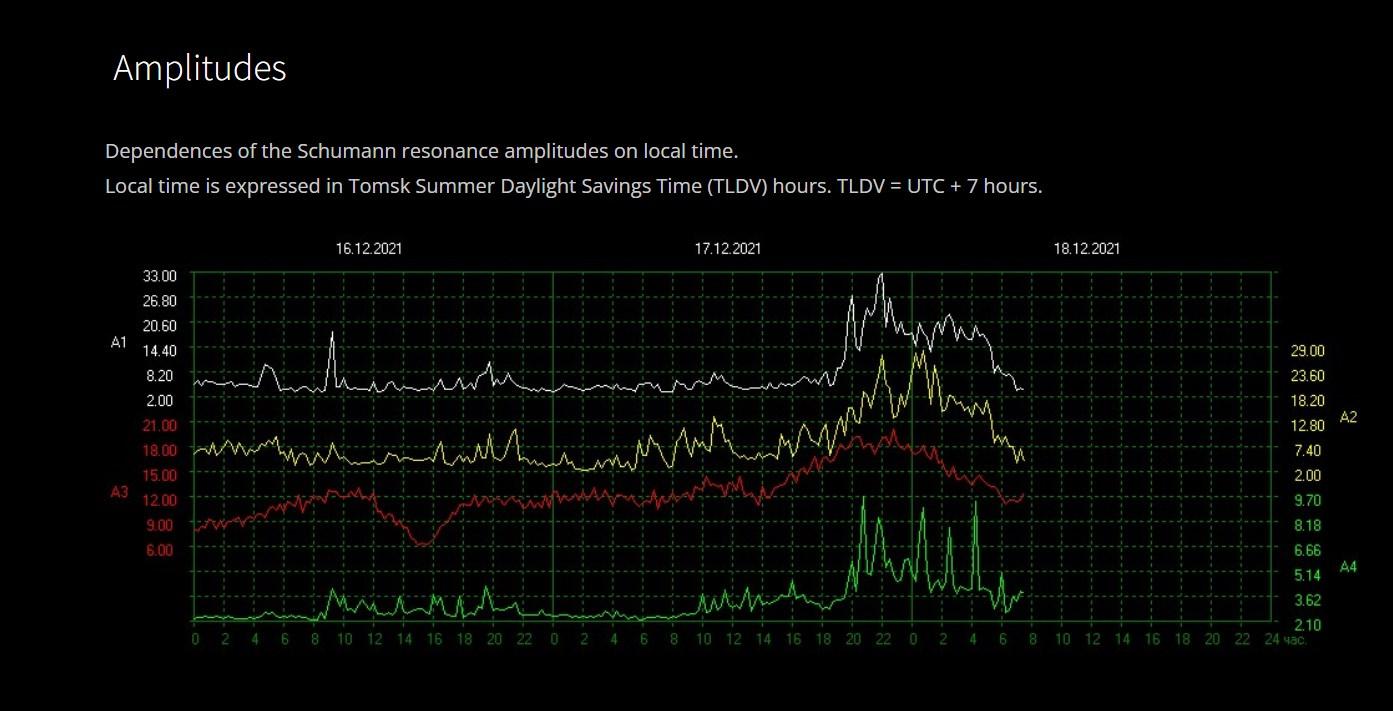
Fig. 5 Amplitude variations as a function of day time (Russian and English version).
An unusual increase of amplitude is noticed between 10 p.m. and 4 a.m., indicating that there has been a strong thunderstorm activity during this time interval. High values of amplitude, which also implies higher energy, may also occur during strong solar activities resulting in solar storms which alter the magnetic field of the Earth.
The third part of the Schumann resonances menu is the Q factor. In order to clearly define this quantity, recall the meaning of the Schumann resonance. There are about 2000 thunderstorms taking place on the surface of the Earth at each moment, producing approximately 50 flashes of lightning every second. Each lightning burst leads to the creation of an electromagnetic wave, of specific frequency, which begins to circle around the Earth. Some of the waves combine in order to produce a resonance wave which encircles the whole circumference of the Earth. The fundamental frequency of this wave is 7.83 Hz. Now, the Q factor refers to the energy loss of the Schumann wave in comparison to the waves that combine and generate the Schumann resonance wave. If the difference between the largest and the smallest frequency of combining waves is small, the Q factor is large and the energy loss is low. Alternatively, if the frequency difference between recombinant waves is large, the Q factor is small and the rate of energy loss is large.
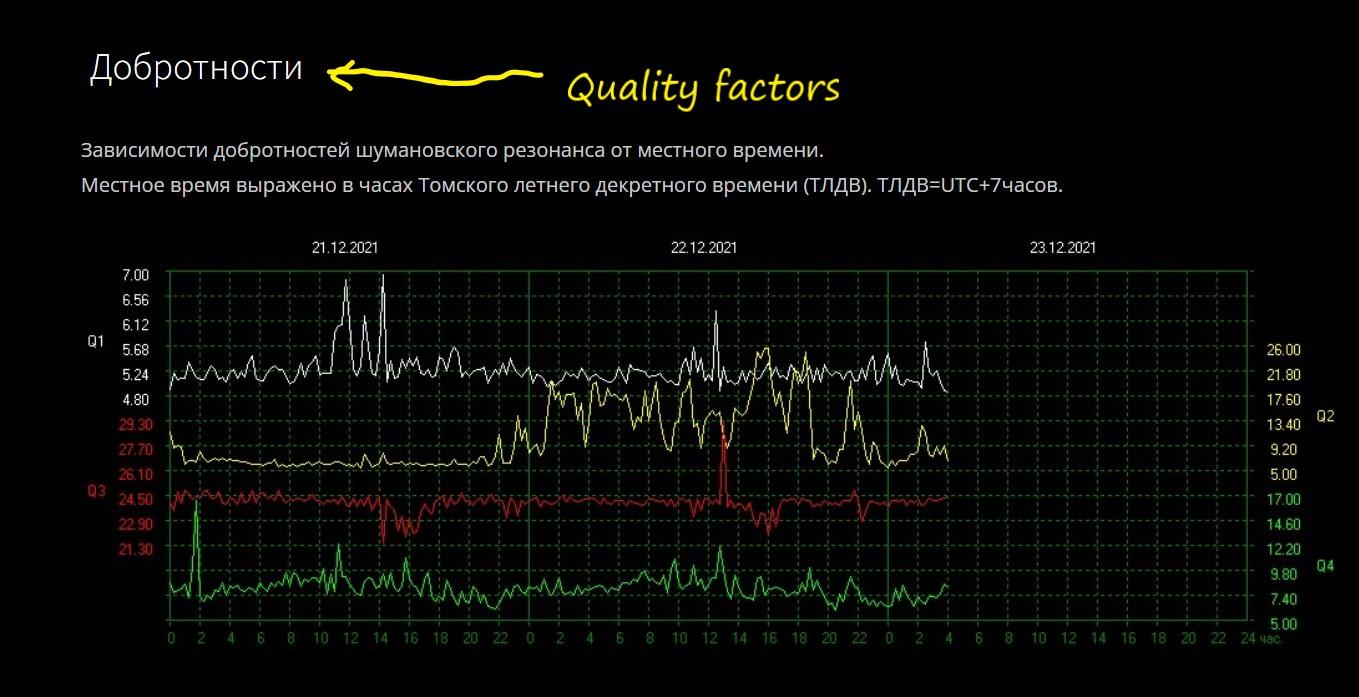
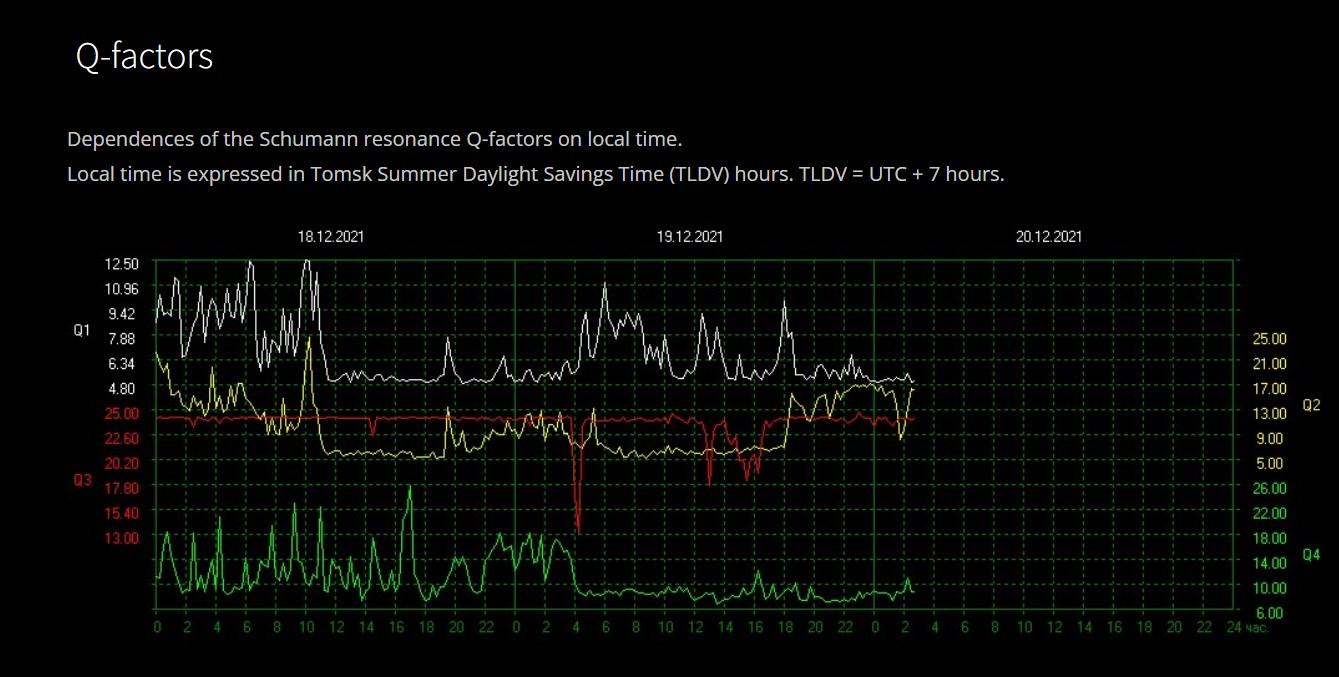
Fig. 6 Q-factors (Quality factors) of the first four harmonics of the Schumann resonances.
If the title of the menu “Schumann resonances” is chosen the following chart appears:
 Or in English:
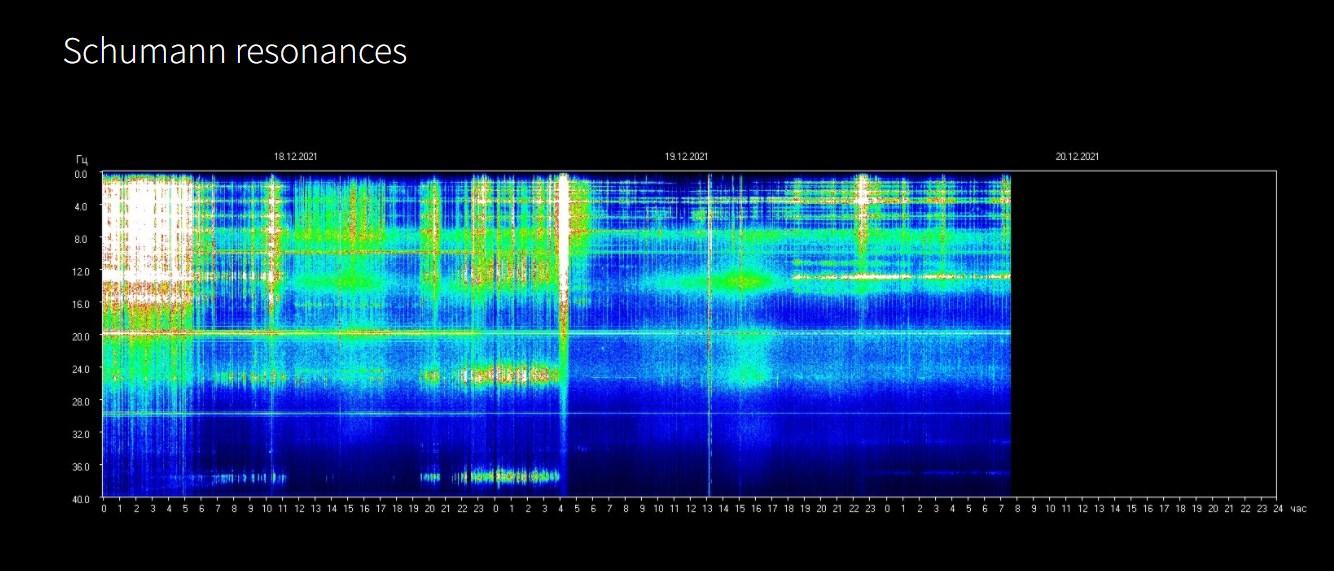
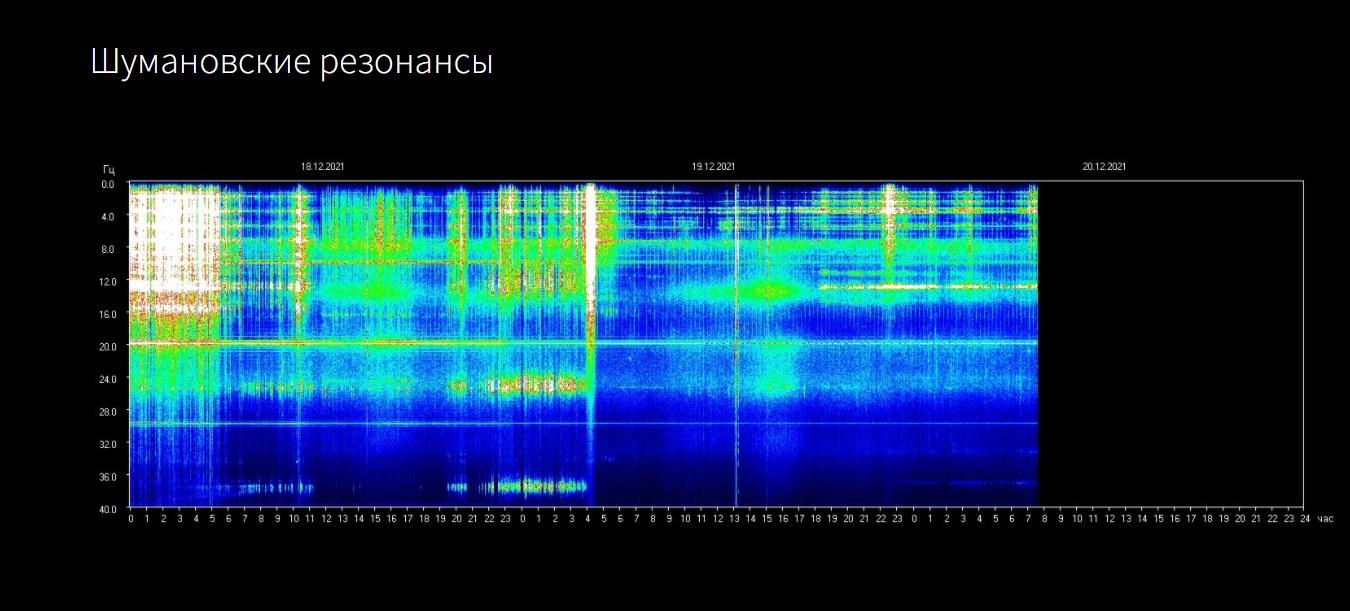
Fig. 7 Three-dimensional chart of frequency and amplitude as a function of day time.
This chart is actually 3 dimensional. Namely, the vertical axis contains frequency values, starting with 0 Hz in the upper left corner, increasing in the downward direction up to the value of 40 Hz. The horizontal axis represents hours of the day and the color represents the amplitude, with blue being the lowest amplitude value (left side in Fig 3) and the values gradually increasing in the right direction, reaching white as the highest value.
![]()
Fig. 8 Colors representing signal amplitudes. The lowest value is blue (left) and the highest value is white (right).
Note that there are very strong bursts in amplitude in the early morning hours, probably due to the strong thunderstorms in the Tomsk region, as seen in the “Amplitudes” chart, earlier.
To summarize, it is important and beneficial to monitor daily variations of the Schumann frequencies and amplitudes mainly due to health reasons. Variations in frequency, particularly in the higher harmonics and/or large bursts of amplitude may affect blood pressure, trigger onset of oxidative stress, feeling of tiredness, anxiety, depression etc. Under such circumstances it is advisable to use Lucha device in order to restore proper body functioning and balance. And finally, here is how Schumann resonances correspond to the brain wave frequencies
Delta: 0 Hz to 4 Hz corresponds with Schumann resonance (SR) around 4.0 Hz
Theta: 4 Hz to 8 Hz corresponds with SR 4.0 Hz, SR 7.83 Hz
Alpha: 8 Hz to 12 Hz corresponds with SR 7.83 Hz
Beta: 12 Hz to 30 Hz corresponds with SR 14 Hz, 20 Hz, 26 Hz
Gamma: 30 Hz to 100 Hz corresponds with SR 33 Hz, 39 Hz, 45 Hz, 59 Hz.
By monitoring changes in frequencies and amplitudes of Schumann signals, it is possible to notice some regularities and connections between the occurrence of certain mental and health conditions and how the use of Luca t8 may affect them.